
https://physics.stackexchange.com/questions/113290/simulate-plot-electrostatic-field
Windows:
DEMO_XY.exe 23

Linux:
./DEMO_XY.run 23
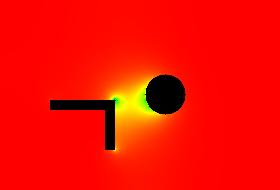
Each pixel of picture represents one mesh node.
white colour - vacuum
red colour   - electrode 1
green colour - electrode 2

mesh size:

number of rows    ==  190
numner of columns ==  280

coordinates:
x_start ==  +0.0   [mm]
x_stop  ==  +279.0 [mm]
y_start ==  +0.0   [mm]
y_stop  ==  +189.0 [mm]

number of iterations

>>> SUCCESS - solution V(x,y) has been found
after 157145 iterations

electrode 1 (red A+B)
(A)
boundary ==  +1
voltage  ==  +9.0 [V]
i_col    ==  51 .. 115
i_row    ==  81 .. 90
(B)
boundary ==  +1
voltage  ==  +9.0 [V]
i_col    ==  106 .. 115
i_row    ==  41 .. 80

electrode 2 (round, green)
boundary ==  +2
voltage  ==  +0.0    [V]
x_center ==  +165.0  [mm]
y_center ==  +95.0   [mm]
radius   ==  +20.0   [mm]


computation accuracy:
eps ==  1.0E-9 [V]
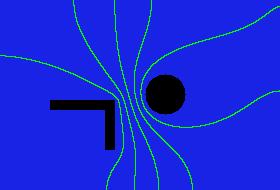

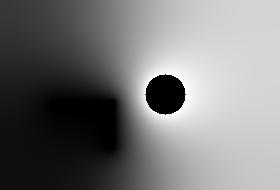
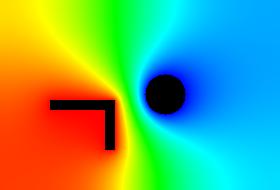
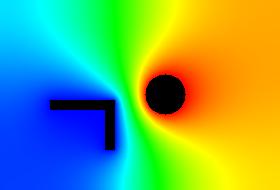
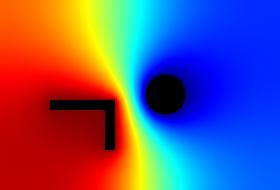
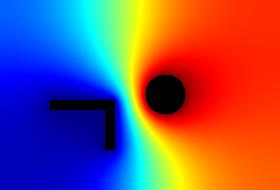
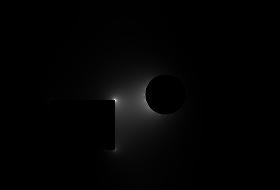
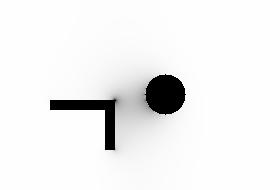
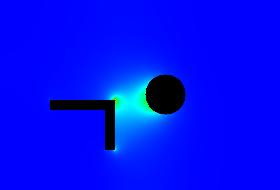
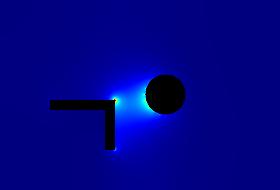
Important: determinig of exact values of E near electrode surface is generally problematic. These maps have generally illustrative character.

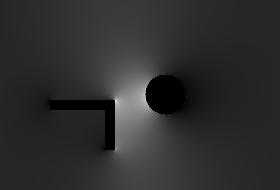
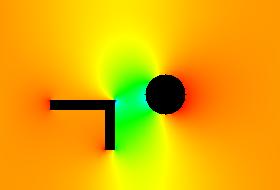
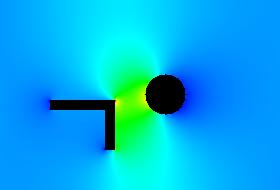
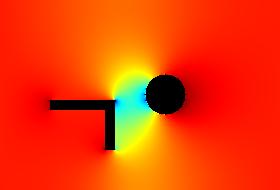
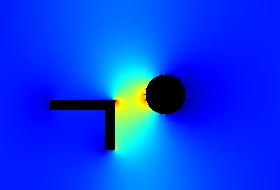
Important: determinig of exact values of E near electrode surface is generally problematic. These maps have generally illustrative character.
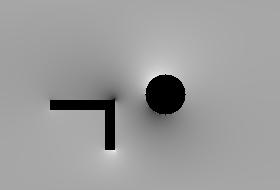
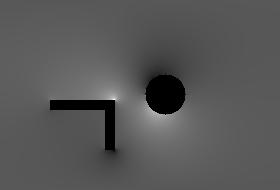
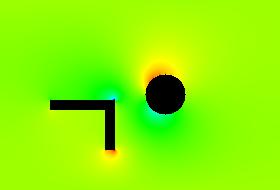
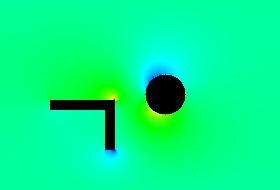
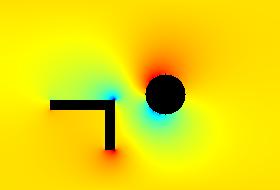
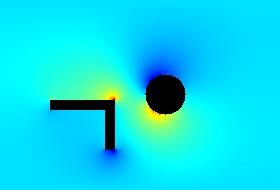
algorihm of computation:
E = sqrt(E_x*E_x + E_y*E_y)
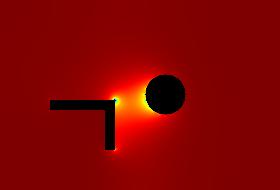
Important: determinig of exact values of E near electrode surface is generally problematic. These maps have generally illustrative character.


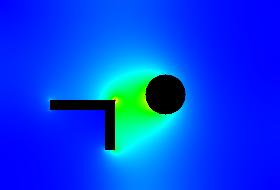
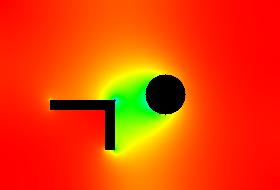
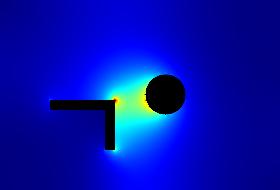
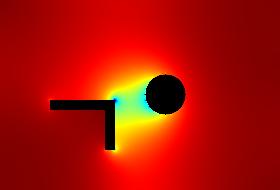
algorithm of computation:
E*E = E_x*E_x + E_y*E_y
Important: determinig of exact values of E near electrode surface is generally problematic. These maps have generally illustrative character.
This static site does not use any cookies or gather any data.